Question 5: Lands’ End web sales actually surpassed its catalogue sales growth rate. How does Land’s End account for this boom?
To fully answer this question, both consumer behavior and technological advances need to be examined. In 2000, Land’s End online sales reached $138M, the first time they surpassed catalog sales. To attribute this growth to any one factor would be a short-sighted as there were several factors that were simultaneously at play.
- Organic Internet Growth: The natural growth rate of Internet users has been staggering from in inception of the World Wide Web in 1995 to the point of Land’s End web sales surpassing its catalog sales in 2000.
Figure 2. World Internet Population and Growth Rate

Table 3. Sales growth between online and catalogue shopping[1]
| US Figures
Billions |
Total Retail Sales | % Growth | Catalogue Sales | % Growth | Internet Sales | % Growth |
| 1996 | $2,500 | $69.5 | $0.75 | |||
| 2000 | 3,200 | 110.2 | 28.0 |
[1] http://retailindustry.about.com/library/bl/q2/bl_dma060401a.htm
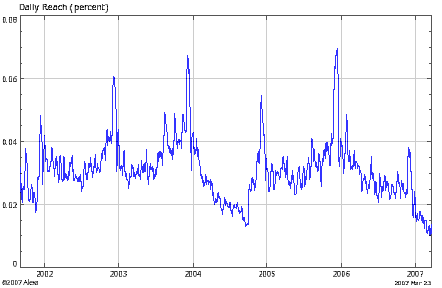
Figure 3. Land’s End Reach of World Wind Internet Traffic

Source http://www.alexa.com/data/details/traffic_details?url=www.landsend.com
Both Figure 1 and Table 1 highlight a penetration problem for Lands’ End’s e-Commerce model. As the growth rate of the Internet population slows and retail competition increases, Lands’ End’s sales growth rate will also decrease. An example of this growing problem is Lands’ End’s position in China, one of the world’s fastest-growing economies and Internet populations. In China, the website www.landsend.com ranks 83,016 among all available websites. This ranking is quite low considering Lands’ End ranks 975 in the U.S. Table 1 specifically highlights a major drop off of the percentage of Internet reach which began with smaller than anticipated Christmas ’06 sales.
Table 4. Lands’ End Online Customer Base
Landsend.com users come
|
| United States82.6% |
| Canada3.4% |
| Singapore1.4% |
| United Kingdom1.2% |
| Japan0.9% |
| Israel0.9% |
| China0.8% |
| Germany0.6% |
| Hong Kong0.5% |
| Spain0.5% |
| Italy0.4% |
| Australia0.4% |
| India0.4% |
| Cyprus0.3% |
| Poland0.3% |
| Puerto Rico0.3% |
| Switzerland0.2% |
| New Zealand0.2% |
| Croatia0.2% |
| Egypt0.2% |
| Qatar0.2% |
| Jordan0.2% |
| Greece0.2% |
| Saudi Arabia0.2% |
| Taiwan0.1% |